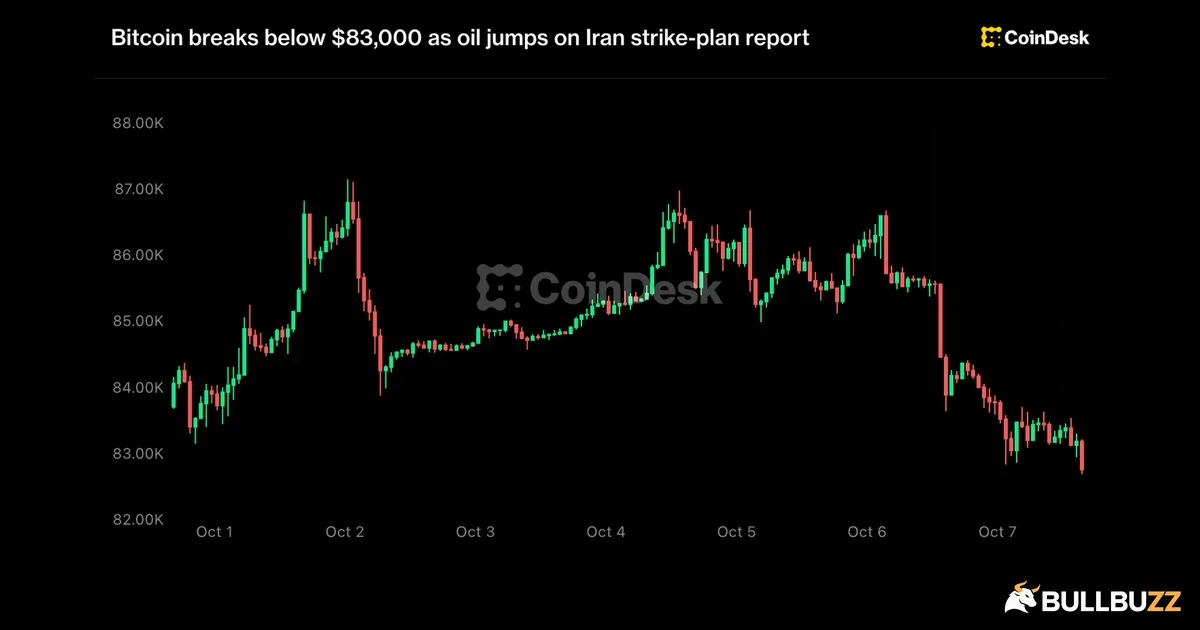
Bitcoin fell 1.6% to just under $82,800 during Thursday’s Asian morning session as a jump in oil prices pushed bond yields higher and returned macro risk to the centre of crypto trading, CoinDesk reported.
Brent crude climbed 2% to above $102 a barrel, while the U.S. 10-year Treasury yield rose two basis points to 5.31%. These figures describe the Asian-session report, rather than a live Bitcoin quote.
The reversal followed a sharp recovery. On October 7, BullBuzz reported Bitcoin nearing an eight-month high as spot exchange-traded fund inflows extended a third week in its latest crypto update. A separate BullBuzz oil update tracked Brent at $103.91 at the European open after a tanker reported being hit near Qatar. The latest crypto decline is unfolding amid several market risks, not one confirmed cause.
Oil and Yields Reset the Risk Tone
CoinDesk cited a report that the White House had asked the Pentagon to prepare strike options against Iran. The outlet also noted that a storm had shut some U.S. oil output and that Houthi rebels struck two airports in Saudi Arabia, killing three people. Those reports added to energy-supply concerns; they do not mean a U.S. strike occurred or that oil shipments stopped.
For Bitcoin, the route from higher oil to lower prices runs through market expectations. Costlier energy can lift near-term inflation compensation. If bond yields rise in response, fixed-income assets offer more income and financial conditions can tighten, weighing on appetite for volatile positions.
The Federal Reserve’s September 15–16 meeting minutes said near-term inflation compensation had risen largely with oil prices, while Treasury yields and the market-implied policy path also increased over the intermeeting period. That earlier policy snapshot helps explain why traders watch energy and rates together. It does not predict Bitcoin’s next move.
CoinDesk said Asian shares fell about 1% as global stocks pulled back from records. The broad weakness fits a risk-off session, but timing alone does not prove that oil drove the entire crypto decline. ETF flows, positioning and other digital-asset-specific news can offset or amplify macro pressure.
Leveraged Longs Deepen the Move
About $550 million in leveraged crypto positions were liquidated over the preceding day, mostly bets on higher prices, according to CoinDesk, citing CoinGlass liquidation data. Forced position-closing can add to selling after a key level breaks. The figure measures derivatives positions, not $550 million of spot Bitcoin sold into the market.
Other major tokens also fell in CoinDesk’s Asian-session snapshot. XRP was down nearly 4% to about $1.42, ether lost roughly 3% to around $2,570, and Dogecoin slipped about 3% to below $0.09. The breadth of losses suggests traders were cutting risk across several large tokens rather than responding to a Bitcoin-only event.
Bitcoin’s $83K Break Puts $80K in View
FxPro had identified $83,000 as a level that would confirm sellers had taken control. A break below it could put $80,000 in reach “fairly quickly,” the firm said, according to CoinDesk. That is a conditional scenario, not a guaranteed target. A brief move through a round-number level can reverse; sustained trading below it would make the signal more consequential.
The immediate macro test is whether Brent can retreat below $100, where CoinDesk said it traded on Tuesday, and whether Treasury yields ease. A pullback in both would reduce pressure on risk assets. If oil and yields remain elevated, Bitcoin’s attempt to recover toward its recent highs faces a tougher backdrop.
What Traders Should Watch Next
- Whether Bitcoin stabilizes near $83,000 or continues to trade below that level.
- Brent’s move around $100 and any verified change in supply or shipping conditions.
- The U.S. 10-year yield and inflation expectations; FRED’s daily Treasury-yield series tracks the benchmark over time.
- New liquidation data and ETF flows, which can show whether forced selling is fading or fresh demand is absorbing it.
The next signal is whether higher energy costs keep feeding through to yields. A retreat in Brent and bond rates would ease one source of pressure; a sustained break below $83,000 would keep FxPro’s $80,000 scenario in view. Neither outcome is settled by the Asian-session move alone.